Did you know North Dakota has 13 cities with populations over 5,000 (excluding Minot AFB)? In a state defined by close-knit communities and a tradition of practical politics, you'd expect local elections to bring voters out in force. Yet across North Dakota, mayoral races held in lower-profile June primaries often draw fewer than one in five eligible voters—and in some cities, turnout barely cracks single digits. Over the past four election cycles, turnout in these crucial contests has ranged from a high of 30% in Valley City to under 6% in West Fargo. This article dives into the data, comparing 13 of North Dakota’s largest and most politically active cities from 2010 through 2024. The result is a revealing portrait of civic habits, and the outsized impact of local elections that too few people show up to decide.
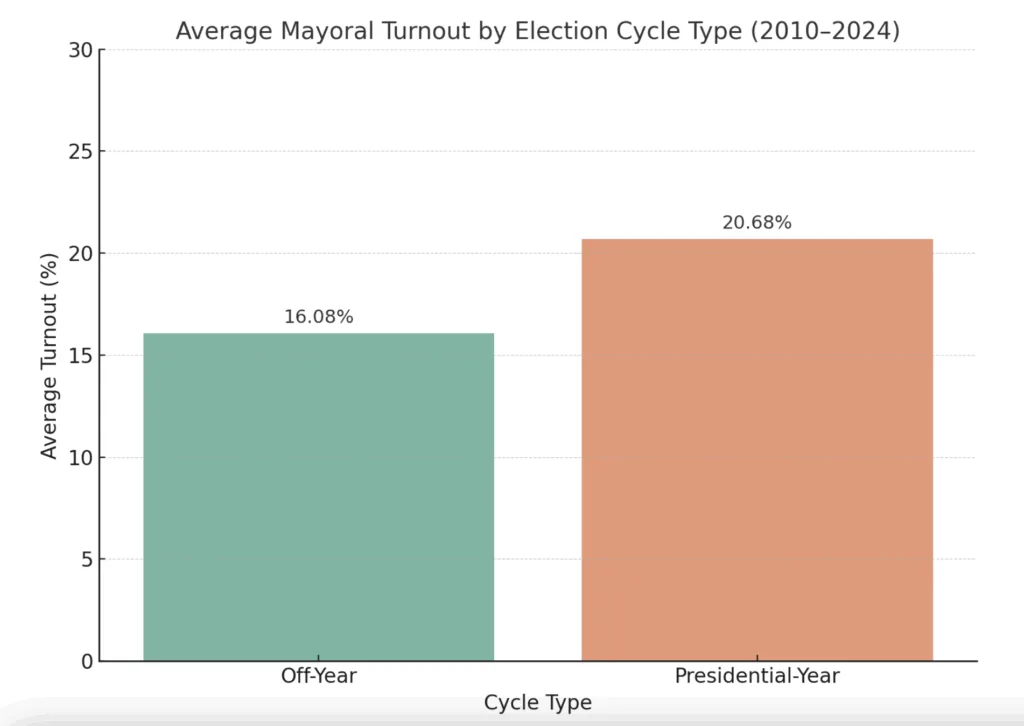
North Dakota cities hold their mayoral elections in two distinct cycles: the off-year cycle, used by cities like Minot, Bismarck, Fargo, and Valley City, which takes place in years such as 2010, 2014, 2018, and 2022; and the presidential-year cycle, used by cities like Grand Forks, Dickinson, and Mandan, which aligns with national elections in 2012, 2016, 2020, and 2024. While one might expect turnout to consistently favor presidential-year elections, and that's largely true, but turnout rates across both models vary widely, and not always in predictable ways.
Before we dive in to the numbers, a little more context on where they all come from. I took the exact mayoral vote totals from the Secretary of State website, but finding exact eligible voter numbers is a little difficult. It is easy to find county numbers from the site, but finding the exact number in a city relies on a little more digging into the census bureau. Taking each city's population estimate for a given year and multiplying it by the percentage of population under 18 from the nearest census. So while numbers may not represent a 100% match for the totals, it is still a fantastic representation of North Dakota's low primary season vote totals.
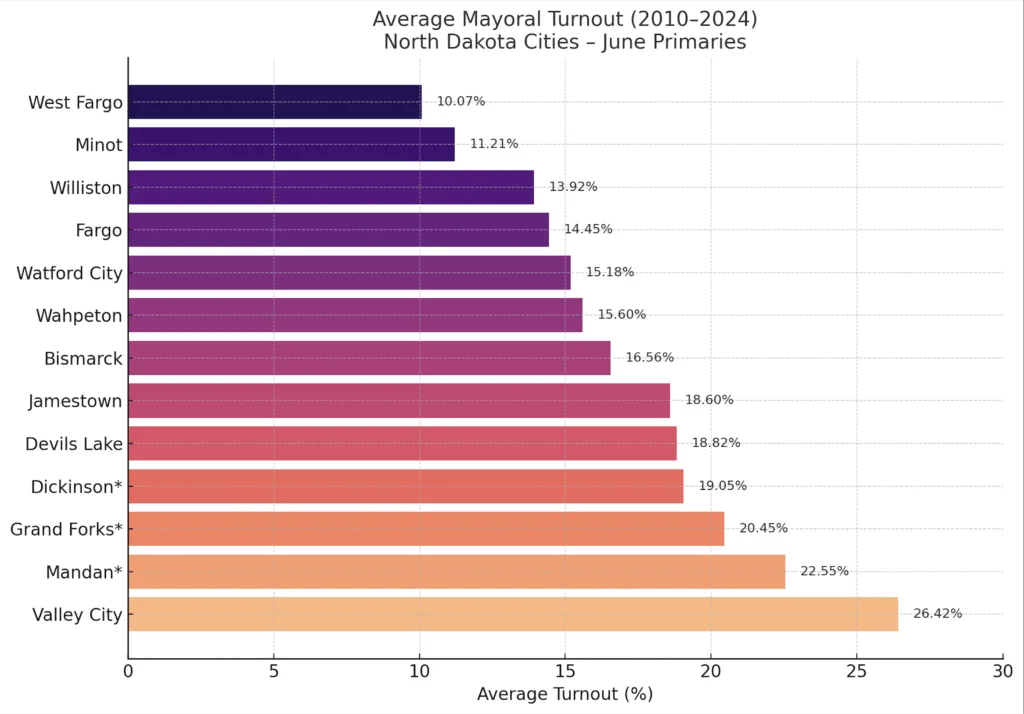
| Rank | City | Avg. Turnout (%) | Quick Takeaway |
| 1 | Valley City | 26.42% | The turnout champion of ND |
| 2 | Mandan* | 22.55% | Presidential-year done right |
| 3 | Grand Forks* | 20.45% | Unopposed incumbents drive turnout down |
| 4 | Dickinson* | 19.05% | Consistent turnout |
| 5 | Devils Lake | 18.82% | Competitive races drive turnout |
| 6 | Jamestown | 18.60% | Off-year version of Grand Forks |
| 7 | Bismarck | 16.56% | Most consistent big city |
| 8 | Wahpeton | 15.60% | Smaller city, solid turnout |
| 9 | Watford City | 15.18% | Boomtown burnout |
| 10 | Fargo | 14.45% | The wildcard |
| 11 | Williston | 13.92% | Turnout in retreat |
| 12 | Minot | 11.21% | Consistently disappointing |
| 13 | West Fargo | 10.07% | Dead last, year after year |
* denotes presidential-year elections
Alright, I get it, this is a lot, so what can we takeaway from all of this? Timing matters—but only if the race does too. While cities that hold mayoral elections during presidential years often enjoy a turnout boost, that advantage only holds when the race is visible and competitive. Mandan and Grand Forks have both benefited from this alignment, but in 2024, Grand Forks turnout collapsed to just 9.9% having a relatively popular incumbent running unopposed. The opposite example is Devils Lake where a long time incumbent retires and is followed by a competitive race. The real drivers of participation are visibility, competition, and public interest, not timing alone. That’s a crucial lesson for cities like Minot or West Fargo, where simply shifting the election date may not fix chronic disengagement.
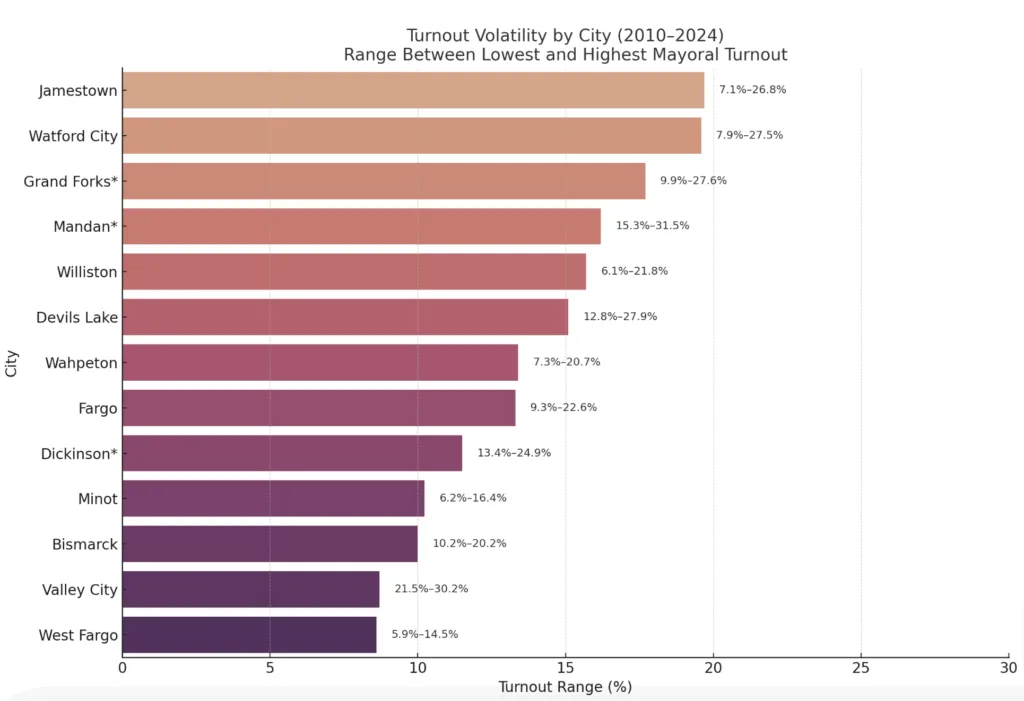
Valley City leads the state with a consistent 26%+ turnout, even in low-interest years. Mandan also performs well, averaging over 22% and peaking at 31.5% in 2012. Meanwhile, Minot, West Fargo, and Williston consistently underperform despite their size and political relevance. Minot has never surpassed 16.4% turnout in any mayoral cycle looked at—not even in 2018, its most competitive and reform-driven race in recent memory. This systemic underperformance suggests some possible deeper issues: civic disengagement, low candidate visibility, and a lack of institutional outreach. When just 10–12% of voters are deciding major policies on infrastructure, childcare, tax policy, and flood protection, it raises real questions about the lack of civic duty and engagement.
Some cities have seen major swings over time:
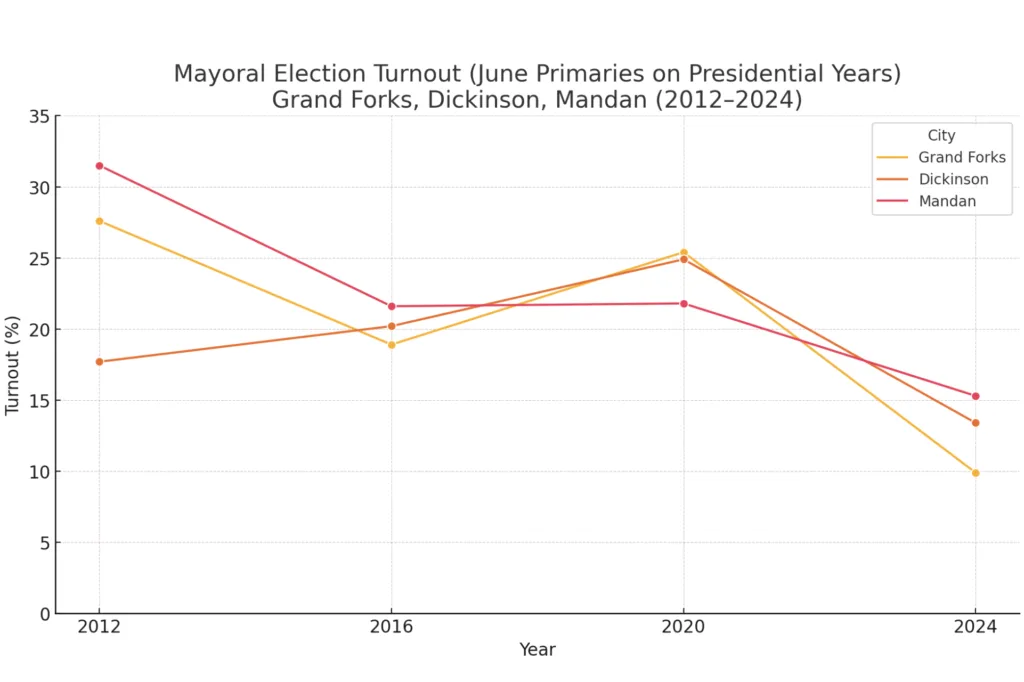
When we isolate the three cities that hold mayoral races during presidential years, the results are striking:
| City | Avg. Turnout | Notable Peak |
| Mandan* | 22.55% | 31.5% in 2012 |
| Grand Forks* | 20.45% | 27.6% in 2012 |
| Dickinson* | 19.05% | 24.9% in 2020 |
All three beat the state average and outperformed most off-year cities, suggesting that combining mayoral races with high-profile national contests in the same year can boost local participation, but only when voters are engaged with the local issues.
In contrast, Grand Forks dropped to just 9.9% in 2024, proving that timing alone won’t save an uninspired or uncompetitive race.
1. Valley City – The turnout champion of North Dakota.
Consistently above 25% every cycle, Valley City sets the statewide standard for civic engagement in mayoral elections.
2. Mandan* – Presidential-year elections done right.
With no cycle below 15% and a high of 31.5%, Mandan shows how syncing local and national ballots can work—when the local race matters.
3. Grand Forks* – Unopposed incumbents drive turnout down
Once boasting nearly 28% turnout, Grand Forks crashed to 9.9% in 2024, showing how far engagement can fall without a compelling local contest.
4. Dickinson* – Consistent turnout
Hovering in the high teens and low twenties, Dickinson proves that stable, modest engagement might just beat erratic highs and lows.
5. Devils Lake – Competitive races drive turnout
Devils Lake surged to the top in 2022 with 27.9%—the highest turnout that year—showing that visibility and competition pays off.
6. Jamestown – Off-year version of Grand Forks
Once a top-tier performer, Jamestown fell by over 15 points between 2018 and 2022. A strong civic tradition is fragile without a competitive race.
7. Bismarck – The most consistent big-city performer.
Never below 10% and regularly near 20%, Bismarck maintains a respectable and stable turnout among large cities.
8. Wahpeton – Smaller city, solid turnout
With every cycle since 2014 above 13%, Wahpeton proves that smaller communities can consistently outperform the state’s largest cities.
9. Watford City – A boomtown burnout.
Turnout peaked at 27.5% in 2010 but has declined ever since, showing how rapid growth and large population fluctuations can weaken civic culture.
10. Fargo – The wildcard.
Fargo is unpredictable: it had the lowest turnout among large cities in 2018, then one of the highest in 2022. Turnout depends entirely on the race and engagement.
11. Williston – Turnout in decline
Williston once posted 21.8%, but now ranks near the bottom with only 6.1% in 2022, reflecting long-term disengagement despite the oil boom.
12. Minot – Consistently disappointing
Minot has never cracked 17% in any cycle. Even competitive races fail to break through a deep-seated voter apathy.
13. West Fargo – Dead last, year after year.
With the lowest average turnout of any city studied, West Fargo hasn’t seen more than 15% since 2010 and continues to decline.
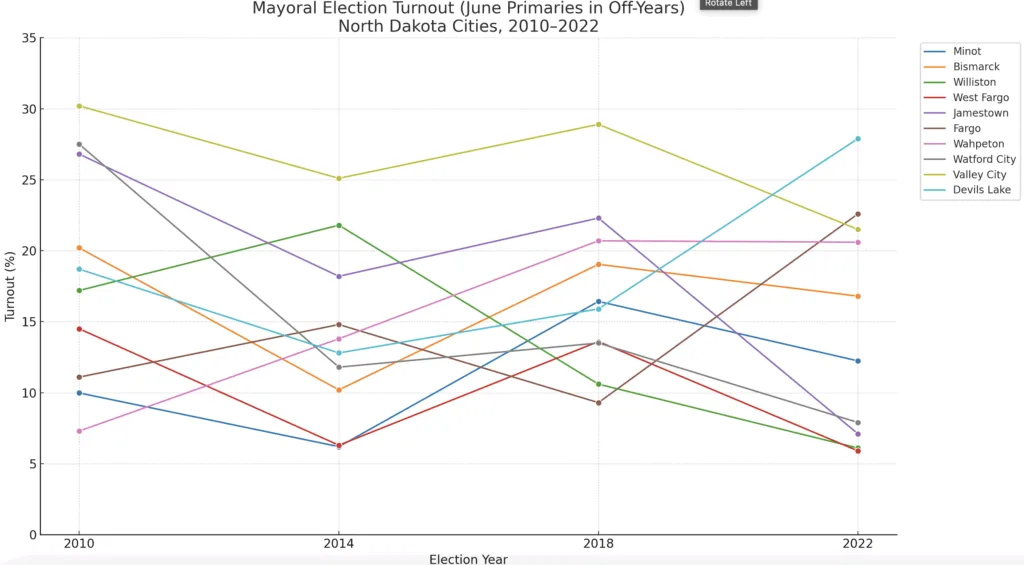
(They are a little hard to look at, but here are the yearly averages)
From Valley City’s 26.42% average turnout to West Fargo’s 10.07%, the data makes one thing clear: local voter participation isn’t driven by city size, resources, or even election timing—it’s shaped by civic culture. Smaller cities like Devils Lake and Valley City routinely outperform major metros, while larger cities like Fargo fluctuate and Minot remains flat. This suggests that improving turnout requires more than statewide reforms; it demands city-specific strategies rooted in local leadership, media, and community engagement.
Who shows up in June ultimately determines who leads in July, yet across North Dakota, local election turnout remains uneven and often alarmingly low. When sometimes only 1 in 10 residents vote for mayor, it’s not democracy in action, it’s democracy on autopilot. We have the most ability to affect change at the local levels. While there’s no universal fix, the data points to potential solutions: aligning local elections with higher-turnout cycles, improving civic knowledge, and focusing more on issue-based outreach than traditional candidate marketing. In a state defined by close-knit communities, higher turnout can be achieved with a little more effort from every single one of us. North Dakota has the easiest and least restrictive voting laws after all, show up with your state ID or license and you're good to go.